We are extremely confident that learning how to implement volume profiles into your trading will drastically improve your performance.
Apex Capital has trained a lot of traders over the span of a 9 year career. A reoccurring theme with unprofitable traders is they trade setups or patterns without applying any sort of context.
I wouldn’t consider this a trading strategy, it’s simply trading a pattern. A trading strategy should not only clearly define your edge but must also define under what context you will execute that edge.
A typical “ah ha” moment for a trader is when they learn to use volume profiles to build context around their trades.
As an data based company, volume profiles are at the core foundation of all of our trading strategies. By the end of this guide you will have a firm understanding of how to use volume profiles.
Excited?
WHAT IS A VOLUME PROFILE
A Volume Profile is an advanced charting indicator that displays total volume traded at every price level over a user specified time period.
Volume Profiles Uses:
-
Identify Key Support and Resistance Levels for Setups
-
Determine Logical Take Profits and Stop Losses
-
Calculate Initial R Multiplier
-
Identify Balanced vs Imbalanced Markets
-
Determine Strength of Trends
Let’s take a look at the basic components of a volume profile.
VOLUME PROFILE COMPONENTS

above is a normal distribution that you might remember from statistics.
In a perfect normal distribution, which the markets never are, 68.26% of all data (in our case trades) occurs within one standard deviation of the mean (point of control). Thus the 70% used by traditionalist when determining fair value.
Prices above or below fair value are considered “unfair” prices (i.e., not accurate reflections of the traded security’s true intrinsic value).
If these concepts are new to you, make sure to find our post in our membership section of auction theory and many more institutional theories, concepts and strategies!
High Volume Node (HVN): Area of high volume relative to surrounding price action
Low Volume Node (LVN): Area of low volume relative to surrounding price action
Analysis of price in relation to high and low volume nodes is useful when building context around your trades. High volume nodes act like gravity. They tend to attract price and try to hold it there.
Conversely, Low Volume Nodes are areas with low gravity. The market often bounces right over these levels, not staying for long because there’s not much gravitational pull. This makes sense because low volume nodes are areas of low liquidity where participation is low. Where as high volume nodes represent where the most transactions took place.
Now that we’ve established the basic components of a volume profile let’s look at several types of volume profile strategies.
new traders are unprofitable because they fail to apply any context to their trades and are simply trading patterns.
For a quick introduction to HVN areas and how to trade in them with a retracement theory In the above volume profile, price closed in the high volume node (value area) seen by the black candlestick.
In order for price to break away from value, either the buyers or the sellers will have to become more aggressive than the other side.When this occurs, it leaves us with a vital piece of information. We now know who the aggressor, buyers or sellers, was at that price level. Therefore, it’s a logical place to look for a trading setup if price retraces back.


As seen in the above illustration, when price is trading below a high volume node or value area, the level will act as resistance. When price is trading above a high volume node or value area it will act as support.
Low Volume Node Breakouts
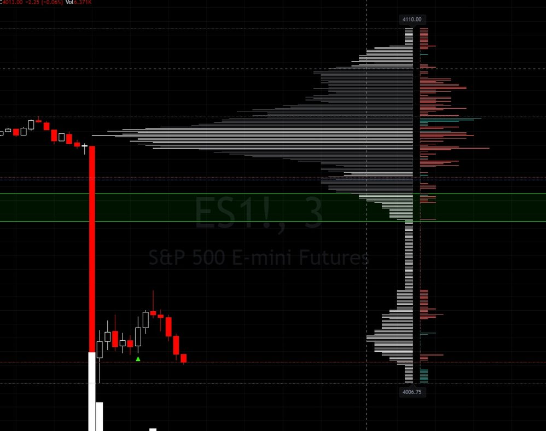
Low volume nodes are zones of low liquidity where price tends to skip right over or completely reject. Remember from earlier they are areas with “low gravity”.
For those of you familiar with market profiles, you can look at low volume nodes similar to single prints.
If you trade a breakout strategy, tracking past low volume nodes will help you find areas of low liquidity that can results in highly profitable trades as they rip through the LVN.
Personally I track Low Volume Nodes on a Daily Chart and project those zones on to my scalping charts. Let’s take a look at an example.

On the Low Volume Node highlighted in green that was intersected by price, you can see how price moved through the LVN with very little effort.
At Apex Capital we mainly use reversion tactics to catch the entirety of the largest moves in the market, these can be identified on both the large time frames and smaller intraday perspectives to track LVN’s.
Types of volume profile structures are covered in our member training section and how to utilize all this information on a day to day basis. Including reversion tactics to catch the markets largest moves!